Every column, badge & filter — explained
The complete reference for the PAI research dashboard and PAI execution panel. Confused by a column? The ? Legend button on the dashboard links straight to the matching section here.
Read What is a zone, then Zone states and the STR score. That is enough to read most of the signals table. Basics live in the glossary.
Panel header metrics
These four numbers always appear at the top of the PAI execution panel, in real time.
| Metric | What it means |
|---|---|
| AVAILABLE | Cash available in your linked trading account for new orders. |
| UTILIZED | Capital currently locked in open positions or pending orders. |
| DAY P&L | Today's profit & loss. Green = profit, red = loss. Updates live through the session. |
| POSITIONS | Number of trades currently open in your account. |
What is a zone?
A zone is a specific price range where the market previously showed a strong reaction — a big rally (demand zone) or a big fall (supply zone). PAI identifies these zones automatically and surfaces them when price returns. Think of a zone as price memory: the same type of buyers or sellers who caused the original move often act again at the same levels.
| Term | What it means |
|---|---|
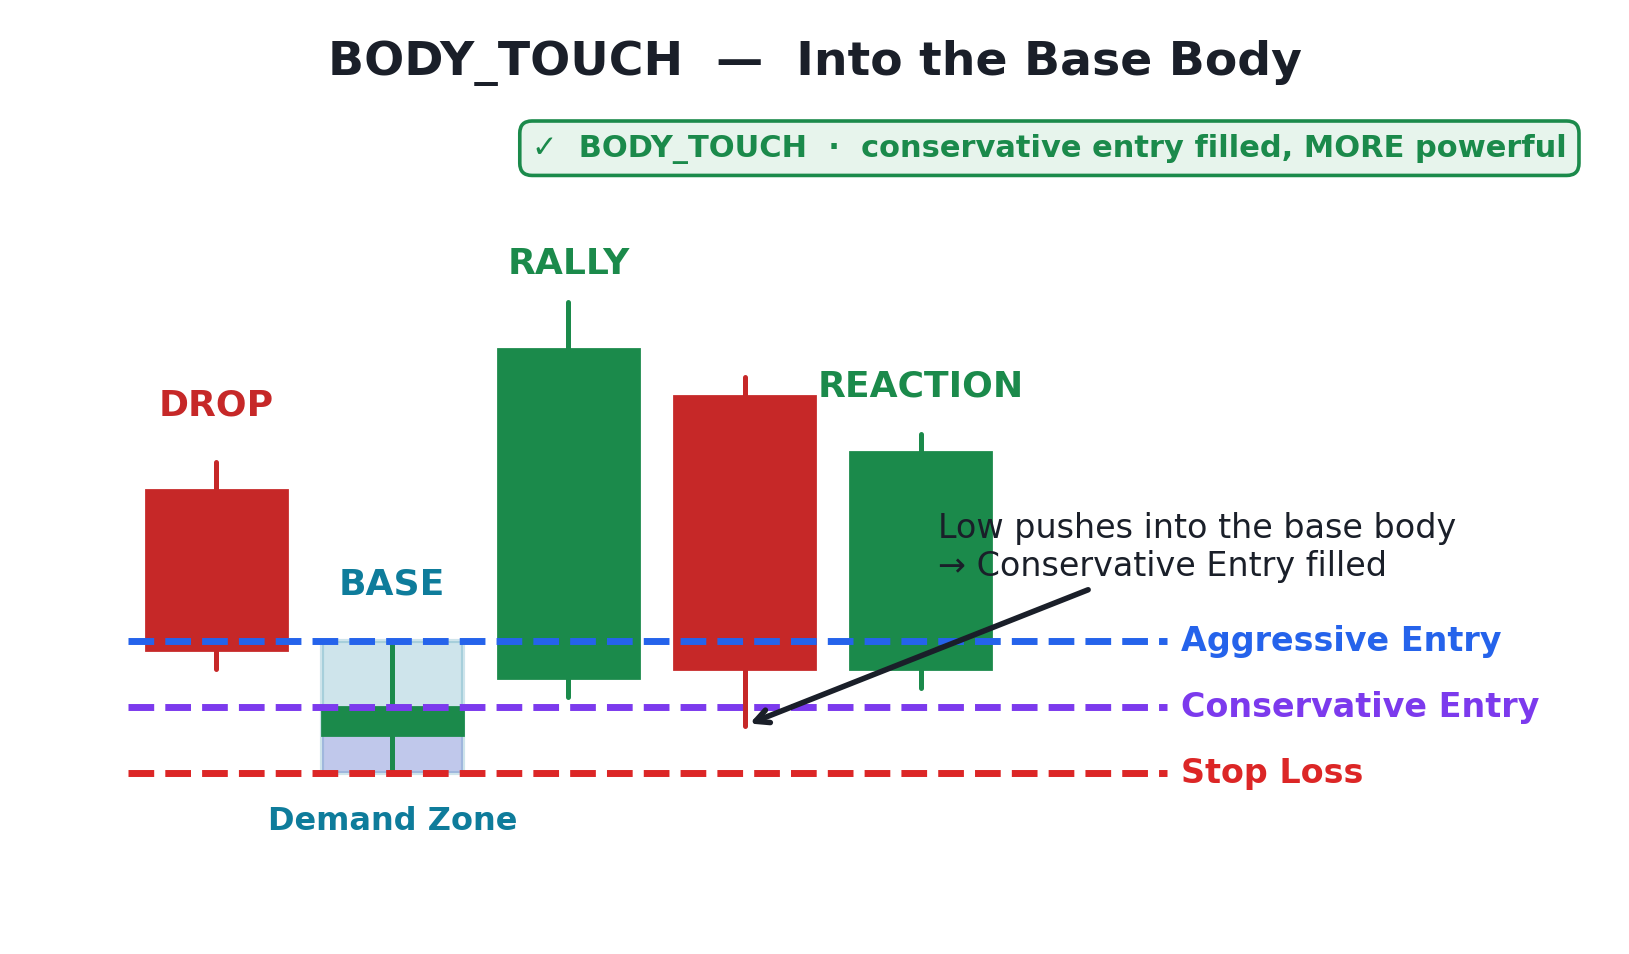
| Base_High | Upper boundary of the zone. The system marks this as the aggressive entry level. |
| Base_Low | Lower boundary of the zone. The stop-loss reference sits just below this level. |
| Base_Close | Close of the candle that formed the zone — used for the conservative entry level. |
For the full anatomy with charts, see Demand & supply zones →
Zone pattern types
These are the "shapes" PAI detects to create a zone. Each pattern tells a story about what the market did before the zone formed. Naming rule: D = Drop, and a leading 2 = a two-candle base (written "2Base").
Demand patterns (bullish)
| Pattern | Full name | What happened | Score base |
|---|---|---|---|
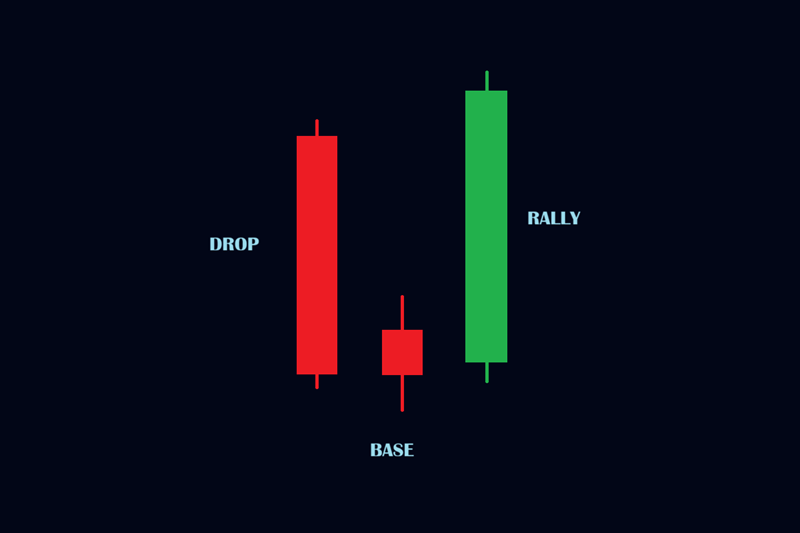
| DBR1 | Drop Base Rally 1 | Sharp drop → weak sideways base → strong rally that erases the fall. The strongest demand pattern: buyers absorbed all sellers. | 7 |
| DBR2 | Drop Base Rally 2 | Like DBR1 with slightly different structural constraints. Still a strong demand zone. | 6 |
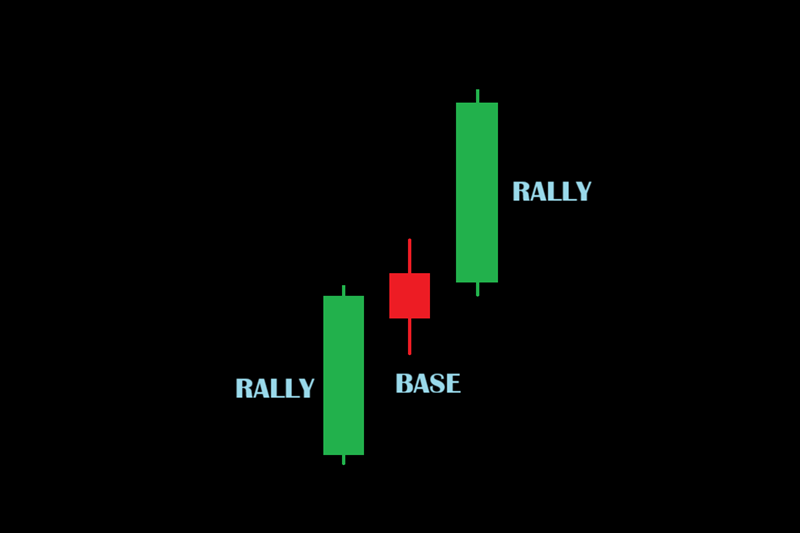
| RBR | Rally Base Rally | Continuation, not reversal — price was rising, rested in a base, then continued higher. | 6 |
| 2DBR1 | Drop 2Base Rally | DBR1 with two weak candles in the base. A wider base can trap more sellers. | 6 |
| 2RBR1 | Rally 2Base Rally | RBR with a two-candle base. Continuation with a wider base. | 6 |
Supply patterns (bearish — resistance / exit levels)
| Pattern | Full name | What happened |
|---|---|---|
| RBD1 | Rally Base Drop 1 | Opposite of DBR1 — price rallied, paused in a weak base, then fell hard. Strong resistance. |
| RBD2 | Rally Base Drop 2 | Variant of RBD1 with different structure constraints. |
| DBD | Drop Base Drop | Price dropped, paused, continued falling. Bearish continuation. |
| 2RBD1 | Rally 2Base Drop | RBD1 with a two-candle base — a wider resistance zone. |
Simple rule: DBR-family = demand (long-side study). RBD-family = supply (resistance levels).
Zone condition states
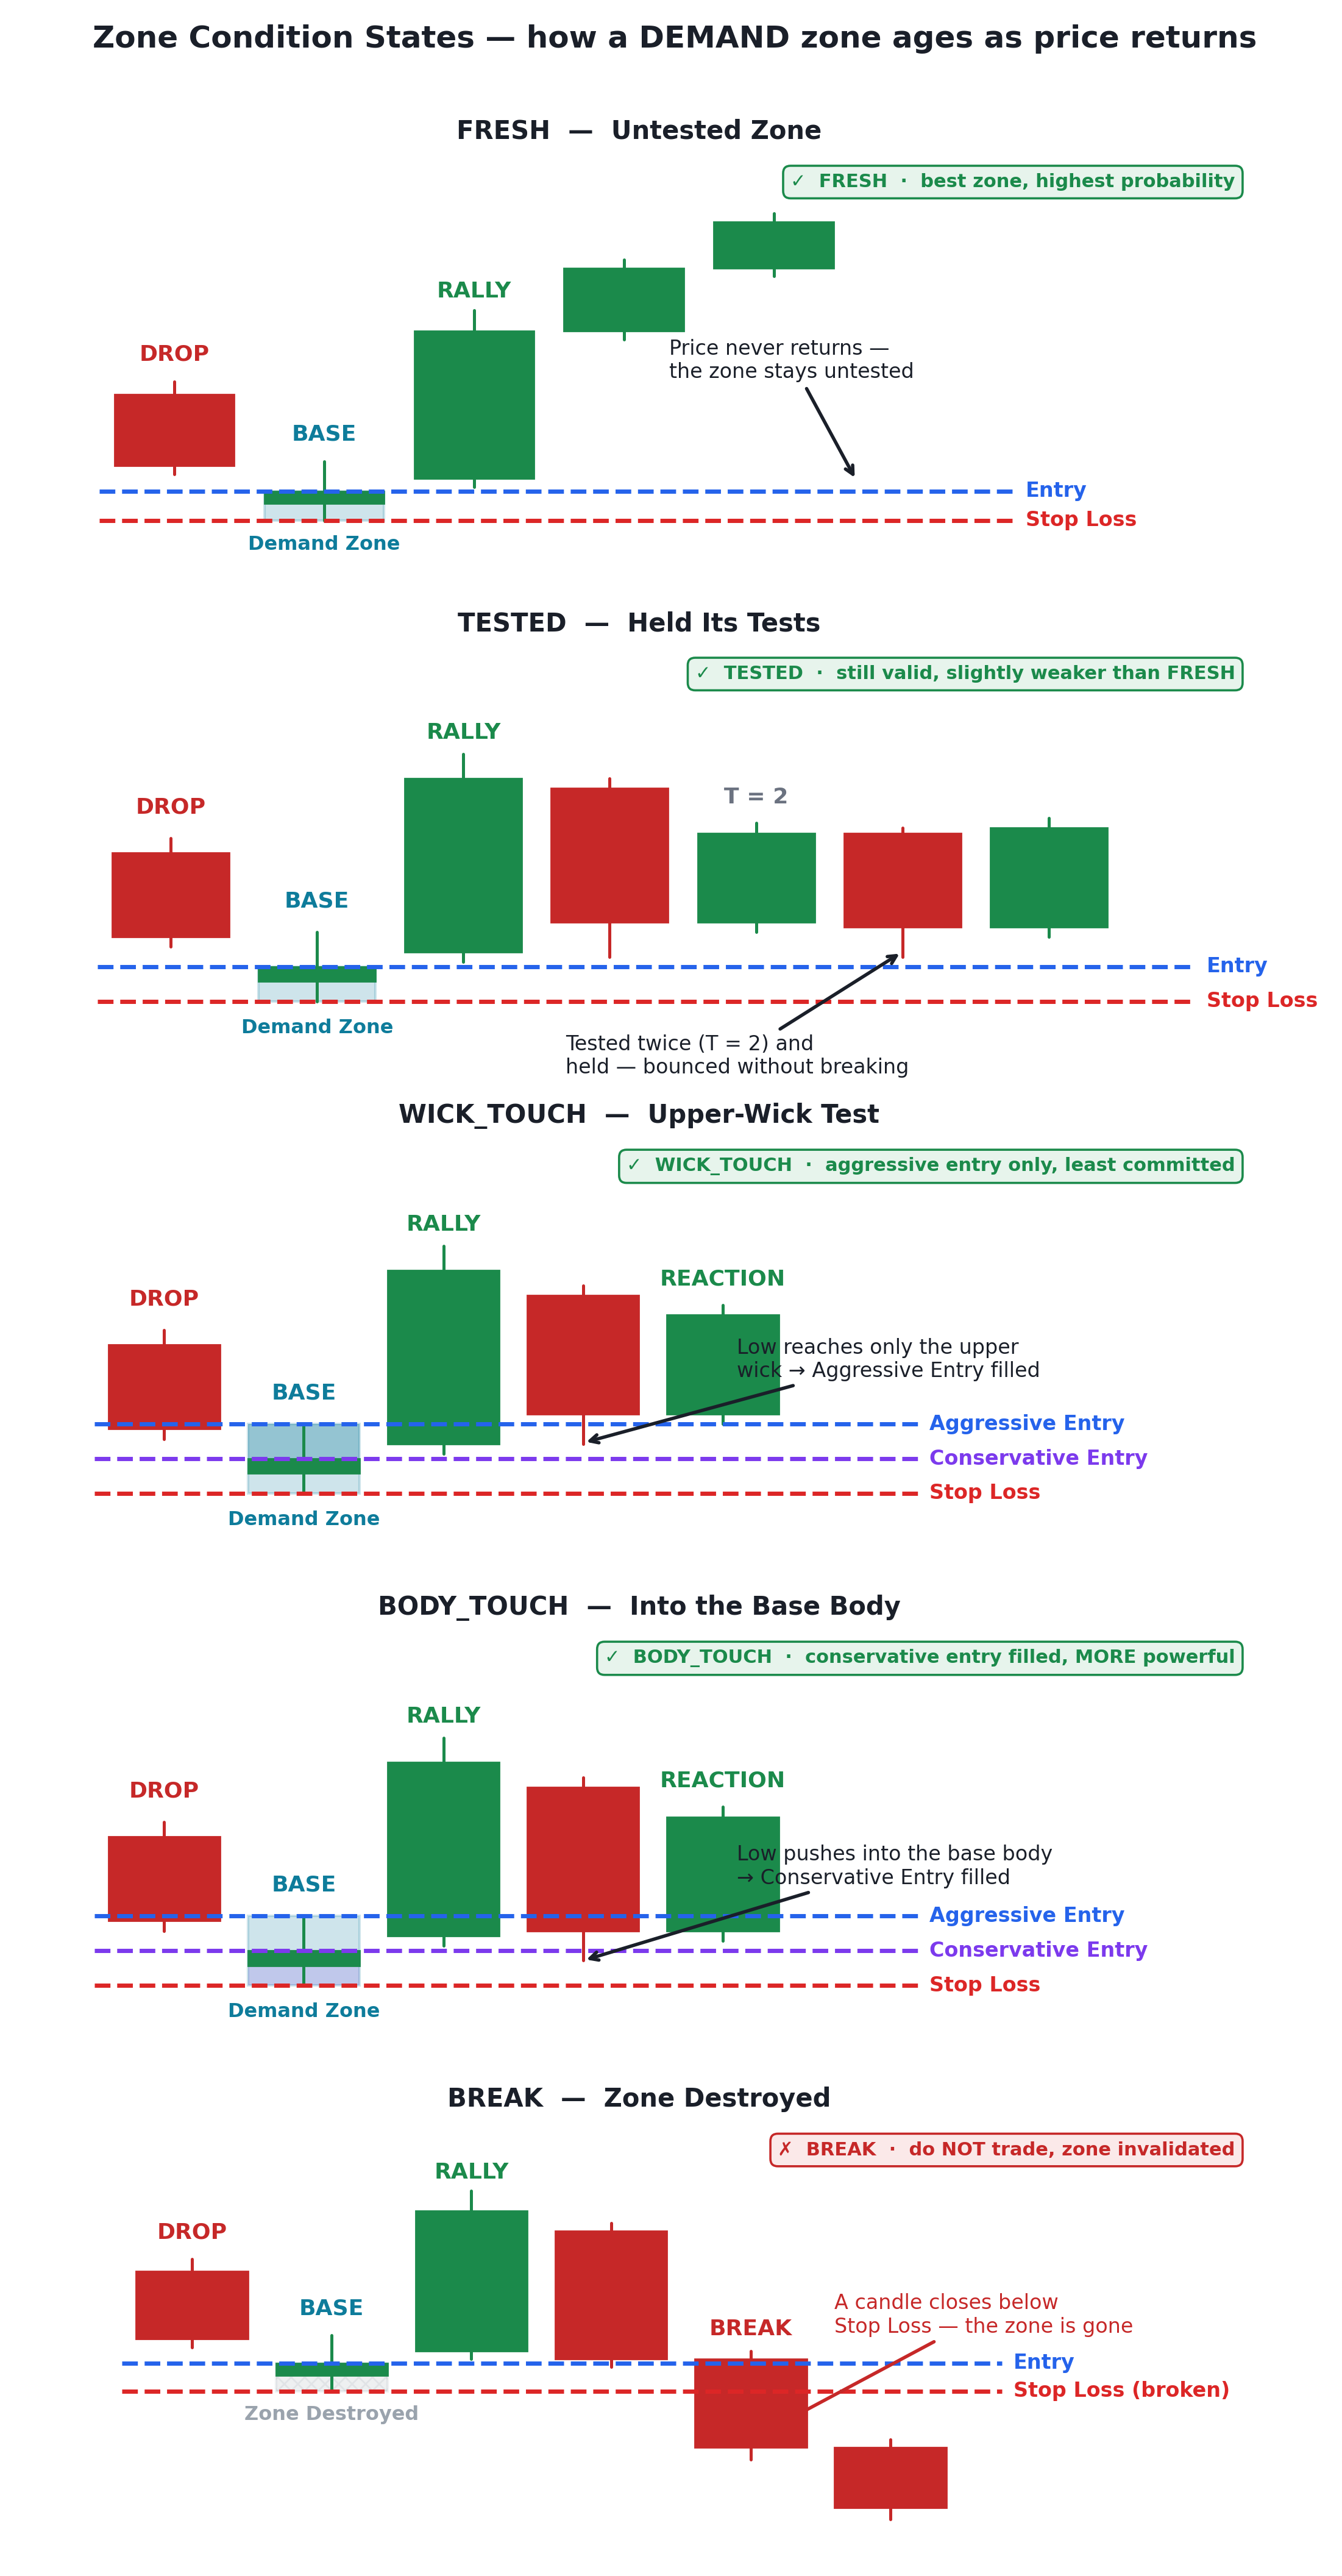
After a zone is created it moves through these states as price interacts with it. The state tells you how fresh — and therefore how potent — the zone still is.
| State | What it means | How the system grades it |
|---|---|---|
| FRESH | Price has never entered this zone. Completely untested. | Highest-probability grade in the model. |
| TESTED | Price entered 1–2 times but bounced back out without breaking. | Still valid; slightly weaker than FRESH. |
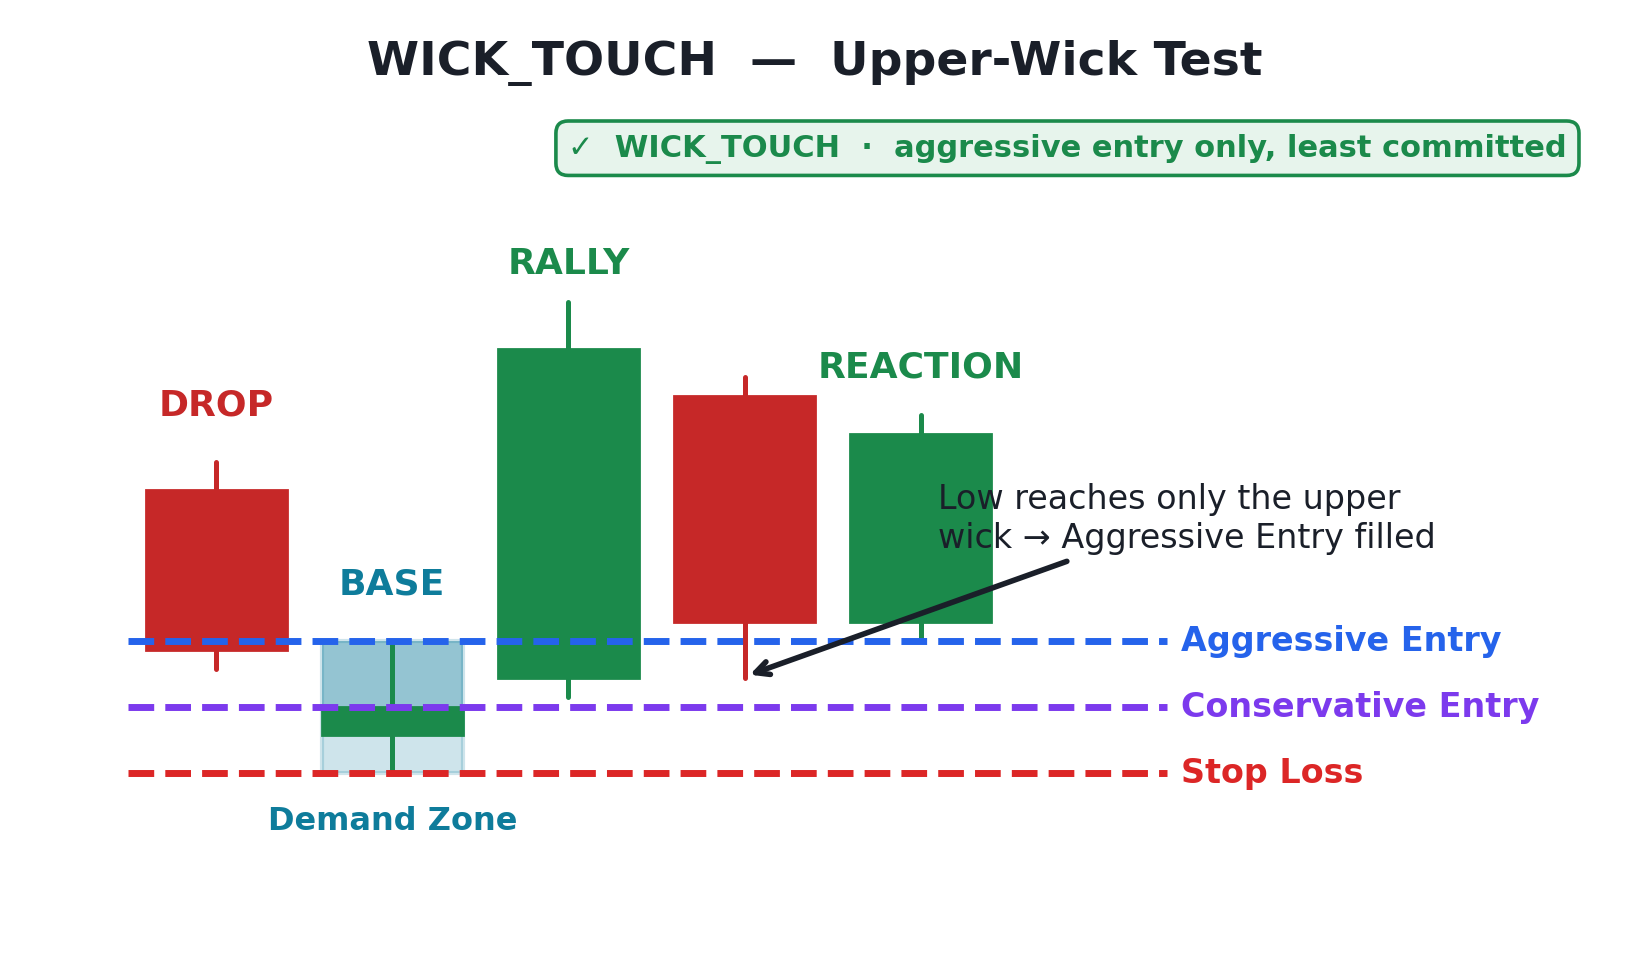
| WICK_TOUCH | The returning candle's low reached only the base candle's upper wick — it tagged the aggressive entry (Base_High) but never the body. | Valid; the least committed kind of test. |
| BODY_TOUCH | The returning candle's low pushed into the base candle's body — reaching the conservative entry level, not just the wick. | Valid and graded more powerful — the conservative level filled. |
| BREAK | Price closed below Base_Low (for demand zones). | Zone invalidated — removed from signals. |
T — Tested count
| T value | Meaning |
|---|---|
| T = 0 | FRESH — never touched. Most potent. |
| T = 1 | Touched once. Still strong. |
| T = 2 | Touched twice. Weaker. |
| T > 2 | Usually filtered out — zones lose potency with repeated tests. |
Execution timeframes
The timeframe chart a zone was detected on. Higher timeframes produce fewer but structurally stronger zones.
| Code | Timeframe | One candle = | Signal frequency |
|---|---|---|---|
| D | Daily | 1 trading day | High — many signals |
| W | Weekly | 1 full week | Medium |
| M | Monthly | 1 calendar month | Low — strong signals |
| Q | Quarterly | 3 months | Very low — very strong |
| H | Half-yearly | 6 months | Rare — extremely strong |
| Y | Yearly | 1 full year | Very rare — most powerful |
Key insight: higher timeframes (Q, H, Y) = fewer signals but much stronger zones with larger potential moves; lower timeframes (D, W) = more frequent signals with smaller individual moves.
Data feeds (watchlists)
The feed selector at the top of the panel chooses which curated scan of zones you are viewing. Higher plans unlock more feeds.
| Feed | What it contains | Plan |
|---|---|---|
| Daily CASH | Daily-timeframe zones on cash / equity stocks (no F&O). | Free |
| Daily Derivatives (Nifty 50) | Daily zones on Nifty-50 F&O names. | Pro |
| Weekly | Weekly-timeframe zones. | Pro |
| Monthly | Monthly-timeframe zones. | Pro |
| Quarterly | Quarterly-timeframe zones (very strong, infrequent). | Pro |
| ALL Derivatives MTF | All F&O names, multi-timeframe blended. | Pro |
| Weekly CASH | Weekly zones on large-cap cash stocks. | Elite |
| ALL MTF | Every name, multi-timeframe blended — the widest scan. | Elite |
Run From — entry trigger types
RUN FROM tells you where, inside a higher-timeframe (HTF) candle, the zone is positioned — which affects how much room the move has. Format: {TIMEFRAME}_{CANDLE_PART}, e.g. H_BODY, Q_WICK.
Body vs wick
     ──── Candle wick / shadow (thin line at top)
┌────┐
│    │  ← Candle BODY (thick coloured rectangle)
│    │
└────┘
     ──── Candle wick / shadow (thin line at bottom)
- BODY zone — sits in the middle of the HTF candle; more room between the zone and the candle's extreme. Graded stronger.
- WICK zone — sits near the candle's extreme edge; less buffer. Valid but tighter.
| Code | Meaning | Confluence |
|---|---|---|
| Y_BODY | Zone inside the body of a yearly candle. | Extremely strong — rare. |
| Q_BODY | Zone inside the body of a quarterly candle. | Very strong. |
| M_BODY | Zone inside the body of a monthly candle. | Good. |
| H_BODY | Zone inside the body of a half-yearly candle. | Very strong, large room. |
| Y/Q/M/H_WICK | Zone at the wick edge of that timeframe's candle. | Valid, tighter room. |
Priority: Y_BODY > Q_BODY > M_BODY > H_BODY > Y_WICK > Q_WICK > M_WICK > H_WICK
Signal table columns
Every column in the signals table, in order.
| Column | Full name | What it shows |
|---|---|---|
| # | Serial number | Row number for easy reference. |
| SYMBOL | Stock symbol | The stock or index ticker (e.g., RELIANCE, NIFTY). |
| STR | Score (strength) | PAI's quality score for the zone. Higher = stronger. How it's calculated → |
| ZONE | Zone label | Pattern type (DBR1, RBR…) + condition (FRESH, TESTED…). Patterns → |
| RUN FROM | Entry trigger | Which HTF candle part the zone runs from. Details → |
| ENTRY | Entry price | The zone's upper boundary (Base_High) — the system's aggressive entry level. |
| SL | Stop loss | The level that caps the studied risk — set 0.5% below Base_Low. |
| TARGET | Target price | Default profit objective derived from the risk distance. Formula → |
| FROM ENTRY | % from entry | How far the current price is from the entry level. Negative = price at/below entry (zone reached). |
| IN SUPPLY | In supply zone | Live check: is price inside / approaching overhead resistance? Full guide → |
| T | Tested count | How many times price has touched the zone. T=0 = FRESH. Details → |
| L | Leg-out | Number of strong bullish candles after the zone formed. Higher = more confirmed momentum. |
| SUPBRK | Supply break | How many pre-existing overhead supplies have broken since the zone formed. Full guide → |
| Hist ATH% | Historical ATH distance | How far the close sat below the all-time high that existed when the zone formed (backtest-safe rolling high). E.g. −30% = 30% below that record. |
| Disc.Peak | Discount to peak | How far the close sits below the stock's lifetime all-time high. Deeper discount = more recovery room up to the peak. |
| CREATED | Zone creation date | When the zone was first detected by the system. |
Hist ATH% vs Disc.Peak: Hist ATH% is frozen at zone formation (what the discount looked like then); Disc.Peak is measured against the lifetime high (what the discount looks like now).
Row badges & markers
Small tags next to a signal give extra context at a glance.
All-time-high breakout. The zone formed below a prior all-time high that price has since broken — blue-sky territory with no overhead supply left above.
Cross-HTF stacked demand. Yearly / quarterly / monthly zones overlap in the same price band; the tag shows the combined band and the estimated risk reduction. Stronger, lower-risk confluence.
The most recent test closed as a candle body inside the zone — a committed, stronger test (vs a wick-only touch). See zone states →
Multi-timeframe overlap markers: the zone overlaps a higher-timeframe zone with body acceptance (★★), fully (★), or partially (~). More complete overlap = stronger confluence. Matching filters →
EMA-20 trend (Probability Stacking): the EMA-20 direction on the zone's own timeframe and the next-higher timeframe. ▲ up · ▼ down · ▬ sideways. Two ▲ means the trend backs the long side — higher probability; opposing arrows mean weaker odds.
A standing GTT order or a price alert already exists for this signal — it has been "actioned". The Hide Actioned filter removes these rows.
Filter buttons
Quick-action toggles
| Button | What it does |
|---|---|
| Hide Actioned | Hides signals you have already acted on (order or alert placed). The number shows how many are hidden. |
| Hide In-Supply | Hides signals where price is currently inside or approaching a resistance/supply zone. |
| ★ BODY | Only zones whose latest touch was a candle-body close inside the zone (strong test). |
| ~ WICK | Only zones whose latest touch was a wick spike (price bounced straight back). |
| ★★ BODY-OVR | Zones with body-confirmed multi-timeframe overlap. |
| ★ FULL | Zones that fully overlap a higher-timeframe zone (complete MTF alignment). |
| ~ HALF | Zones that partially (~50%) overlap a higher-timeframe zone. |
| ⧉ STACKED | Only cross-HTF stacked demand — Y/Q/M zones overlapping in one price band. |
Numeric filters
| Filter | Meaning | Typical use |
|---|---|---|
| STR ≥ | Minimum strength score. | 8 keeps good zones; 10+ keeps only the top grades. |
| T ≤ | Maximum tested count. | 1 shows FRESH + once-tested; 0 shows FRESH only. |
| L ≥ | Minimum leg-out (follow-through candles). | L ≥ 1 keeps zones with confirmed momentum. |
| FROM ENTRY ≤ % | Maximum distance of current price from entry. | ≤5% surfaces zones price is close to testing. |
| Hist ATH% ≤ | Historical discount when the zone formed. | Lower % = deeper historical discount. Column → |
| Disc.Peak ≤ | Discount to the lifetime all-time high now. | For studying deep-discount / recovery candidates. Column → |
STR score — how zones are ranked
The STR (strength) score is PAI's single-number rating for each zone — it combines several measurable factors so dozens of zones can be ranked at a glance. On the dashboard this column may simply be labelled Score.
| Factor | Points | Why it matters |
|---|---|---|
| Pattern type | 5–7 base | DBR1 starts at 7 (strongest); other patterns 5–6. |
| Leg-out (L) | +1 / candle | More follow-through after the zone = higher confidence in direction. |
| Freshness (T) | +8 if T=0 · 0 if T=1 · −1 if T=2 | Untouched zones are the most potent; freshness is heavily rewarded. |
| Multi-TF overlap | +bonus | The zone aligns with a higher-timeframe zone — powerful confluence. |
| Gap-up open | +1 | Price gapped up from the zone area — an extra bullish footprint. |
| Measured move | +1 / 2× range | A prior rally of 2× the zone range indicates trend strength. |
| Score range | Grade | How the model treats it |
|---|---|---|
| STR < 6 | Weak | Low-probability grade — typically filtered out. |
| STR 6–7 | Acceptable | Passes only when other quality factors are strong. |
| STR 8–9 | Good | Standard study-quality setup. |
| STR 10–11 | Strong | High-confidence grade. |
| STR 12+ | Elite | Rare — the top grade in the scoring model. |
The public scoring methodology is described in How PAI scores zones →
Supply zones vs demand zones
| Feature | Demand zone | Supply zone |
|---|---|---|
| Direction | Bullish (long-side study) | Bearish (resistance) |
| Pattern names | DBR1, DBR2, RBR, 2DBR1, 2RBR1 | RBD1, RBD2, DBD, 2RBD1 |
| Price action | Falls into the zone → bounces up | Rises into the zone → falls down |
| Typical use | Long-entry study level | Exit reference or resistance level |
In Supply — live overhead check
IN SUPPLY is a live column. For every demand signal it checks the stock's current price against active overhead supply zones across Daily, Weekly, Monthly and Quarterly timeframes — and tells you in real time whether the stock is running into seller resistance or has clean air above. It refreshes every 60 seconds and on each price tick. A demand zone wants to push price up; an overhead supply wants to push it down — when both apply, the setup is conflicted, and many traders exclude these rows with the Hide In-Supply filter.
Three possible states
| Display | State | What it tells you |
|---|---|---|
| — | No nearby supply | Clean air above — no D/W/M/Q supply within striking distance. Best case. |
| ↑ W −2.3% | APPROACHING | Price is 2.3% below a weekly supply — about to test resistance. Mild caution. |
| 🚫 W INSIDE | INSIDE | Price is currently inside a weekly supply — being actively rejected by sellers right now. |
Approaching buffer scales with timeframe
| Timeframe | Buffer | Reading |
|---|---|---|
| Daily (D) | 1% | Approaching if LTP is within 1% below the supply's lower edge. |
| Weekly (W) | 3% | Within 3%. |
| Monthly (M) | 5% | Within 5%. |
| Quarterly (Q) | 10% | Within 10% — quarterly zones span wide price ranges. |
Priority when several zones match: INSIDE always beats APPROACHING; within INSIDE the highest timeframe wins (Q > M > W > D); within APPROACHING the closest zone wins. Hovering the badge shows the exact supply range, type and score.
SupBrk — supply break
SUPBRK is a historical bullish-confirmation column. For each demand zone it counts how many overhead supply zones that already existed when the demand formed have since been broken by price. More breaks = more seller tiers overcome = cleaner runway above the zone. Unlike IN SUPPLY (live), SUPBRK describes structural progress that has already happened.
Strict confirmation rule
A supply only counts if both are true:
- The supply already existed overhead when the demand zone was created.
- That supply has been broken since (price closed above its top, after the demand was created).
Supplies created after the demand are ignored — they were not overhead resistance at the time, so breaking them later does not validate this specific zone. The scan covers the demand's own timeframe and every higher one.
How the badge reads
| Badge | Meaning |
|---|---|
| — | No qualifying supply has broken yet. Normal for fresh setups. |
| D1 | One daily supply broken. Modest tailwind. |
| M1,W1 | A monthly + a weekly supply broken — multi-TF structural footprint, higher conviction. |
| H1,M2,W3,D5 | Stacked confirmation across four timeframes — buyers have systematically cleared resistance. A Y label (yearly break) is the rarest of all. |
Per-break weight (used for sorting)
| Timeframe | Weight | Why |
|---|---|---|
| Yearly (Y) | 5.0 | Decade-scale resistance — generational signal when it breaks. |
| Half-yearly (H) | 4.0 | Very rare, very meaningful. |
| Quarterly (Q) | 3.0 | Major structural overhead cleared. |
| Monthly (M) | 2.0 | Solid swing timeframe. |
| Weekly (W) | 1.0 | Common but useful confirmation. |
| Daily (D) | 0.5 | Frequent — small weight. |
Sorting the SUPBRK column descending floats the strongest structural confirmations to the top (total weight = Σ count × TF weight).
In Supply vs SupBrk at a glance
| Aspect | IN SUPPLY | SUPBRK |
|---|---|---|
| Time orientation | Live / present | Historical / past |
| Question answered | Where is price right now vs active supplies? | Which overhead supplies have already broken? |
| Refresh | Every 60s + each tick | When zone data is rebuilt |
| Best reading | — (clean air) | High-TF label (e.g. H1,M1) |
High-conviction combination: IN SUPPLY showing — (clean air) and SUPBRK showing a multi-TF label is the strongest structural profile a long-side study can have.
Entry types — Aggressive vs Conservative
| Mode | Level | Trade-off |
|---|---|---|
| ENTRY (Aggressive) | Base_High — the zone's upper boundary. | Fills sooner; the zone is not yet fully confirmed, so the studied risk is higher. |
| ENTRY_C (Conservative) | Base_Close — the close of the zone's base candle. | Waits for a deeper test; better risk:reward when it fills, but fills less often. |
In alert messages, the EC: prefix marks the conservative entry price. The execution panel's Aggr/Cons toggle switches between the two and recalculates target and quantity automatically.
Risk management defaults
| Term | Formula / definition | Example |
|---|---|---|
| SL (stop loss) | Base_Low ÷ 1.005 (0.5% buffer below the zone). | Zone low ₹500 → SL ₹497.50 |
| TARGET | Entry + (Entry − SL) × 2.0 — default 2:1 risk-reward. | Entry ₹520, SL ₹497.50 → Target ₹542.50 |
| Risk-reward | 2:1 by default; configurable in the panel. | Risk ₹1 to study a ₹2 objective |
Why R:R matters more than win-rate: Risk & expectancy →
Order terms
| Term | Full name | What it means |
|---|---|---|
| GTT | Good Till Triggered | A standing order that stays active until the trigger price is hit or you cancel it. Set once, executes automatically. The OCO variant pairs a target leg and a stop-loss leg — when one fires, the other cancels. |
| CMP | Current Market Price | The latest traded price of the stock at this moment (same as LTP). |
Quick-reference cheat sheet
Pattern strength ranking
| Rank | Pattern | Story |
|---|---|---|
| 1 — strongest | DBR1 | Drop → base → strong rally |
| 2 | DBR2 | Drop → base → close above structure |
| 3 | RBR | Rally → base → continue rally |
| 4 | 2DBR1 | Drop → 2-candle base → strong rally |
| 5 | 2RBR1 | Rally → 2-candle base → continue rally |
Freshness: FRESH (T=0) > WICK_TOUCH > BODY_TOUCH > BREAK (invalid)
Timeframe strength: Y > H > Q > M > W > D
Run From: Y_BODY > Q_BODY > M_BODY > H_BODY > Y_WICK > Q_WICK > M_WICK > H_WICK
What a top-graded setup looks like
- ✔ Pattern is DBR1 or DBR2
- ✔ STR ≥ 8
- ✔ T = 0 (FRESH) or T = 1
- ✔ IN SUPPLY shows — (clean air), or SUPBRK shows breaks
- ✔ RUN FROM is a BODY type (not wick)
- ✔ L ≥ 1 (at least one follow-through candle)
- ✔ Hist ATH% not extreme (not −90% or worse)
This describes how the scoring model grades quality — it is an educational profile, not a recommendation to trade any specific signal.
Glossary at a glance
| Short term | Full meaning |
|---|---|
| DBR | Drop Base Rally |
| RBR | Rally Base Rally |
| RBD | Rally Base Drop (supply pattern) |
| STR | Strength score (zone quality) |
| T | Tested count (times the zone was touched) |
| L | Leg-out — follow-through bullish candles after the zone formed |
| Hist ATH% | Historical ATH distance (vs the all-time high when the zone formed) |
| Disc.Peak | Discount to peak — % below the lifetime all-time high |
| SL | Stop loss |
| GTT | Good Till Triggered (standing order) |
| CMP | Current market price |
| TF / HTF / MTF | Timeframe / higher timeframe / multi-timeframe |
| SUPBRK | Supply break — overhead resistance broken (bullish) |
| EC | Entry Conservative — the Base_Close entry level |
| OVR | Overlap — zone overlaps a higher-timeframe zone |
| ⧉ STACKED | Cross-HTF stacked demand — Y/H/Q/M zones overlap in one price band |
| 🏆 ATH | All-time-high breakout zone (blue sky, no overhead supply) |
| D/W/M/Q/H/Y | Daily / weekly / monthly / quarterly / half-yearly / yearly |
See these columns live
Open the dashboard and tap the ? Legend button — every term links back here.
Start freePAI is an educational and analytical platform. We do not provide investment advice or guaranteed returns. All trading decisions and risks remain the responsibility of the user.